

Growing athletic rosters and adding sports
Examining strategies for how small, private colleges are staying afloat

The financial and enrollment management pressures facing small, liberal arts-based, private colleges and universities are well-documented. Readers of Glory Days know of my interest in how athletics fits within this space. If you are a first-time visitor here, there are a few things you should know.
All of my data regarding enrollment, participation, budgets, etc. comes from the Office of Postsecondary Education Equity in Athletics Data Analysis (EADA) website. Universities which receive federal funds are required to report this data annually, with some exceptions (single-gender institutions and service academies, for example). Unfortunately, under the current administration, the EADA website is not updated in a timely manner. The most current data available is for the 2023-24 academic year, creating an 18-month lag. Still, there are benefits in evaluating the data longitudinally, which is what I am seeking to do here.
I love college athletics. I think it is a wonderful part of the campus experience, for athletes and non-athletes alike. I focus on Division III athletics because it is the only division where athletic scholarships do not exist. These institutions tend to be highly dependent on undergraduate students paying tuition in order to fund the school’s operations. It stands to reason, therefore, that D-III schools aggressively compete with one another to attract this shrinking-pool of students. But D-III institutions are most definitely not created equally.
My researcher positionality is as a faculty member and university administrator who has worked a variety of institutional sizes, including as Dean at a D-III school. So, I have seen up close how athletics and enrollment are intertwined. That said, unless I disclose it, I have no first-hand knowledge of administrative decisions being discussed at the college that I am studying. Nor am I privy to detailed internal financial data of the school’s operations. Finally, I am also the parent of a D-III student-athlete.
Over time, I have speculated that as schools exceed 44 percent of athletes on its campus, that it is a sign of financial strain. Athletes simply cost more than non-athlete students with travel, coaches, facilities, equipment, etc. If we assume that all students at a D-III receive the same discount rate, the non-athlete students are helping subsidize the athlete experience. If a school’s percentage of athletes increases while enrollment decreases, this should be viewed by administrators and prospective students and families as a red flag warning of the school’s long-term financial health.
Consider the following D-III schools that have closed/merged in the past few years (or will close/merge) and their percentage of athletes as of the school’s final EADA report:
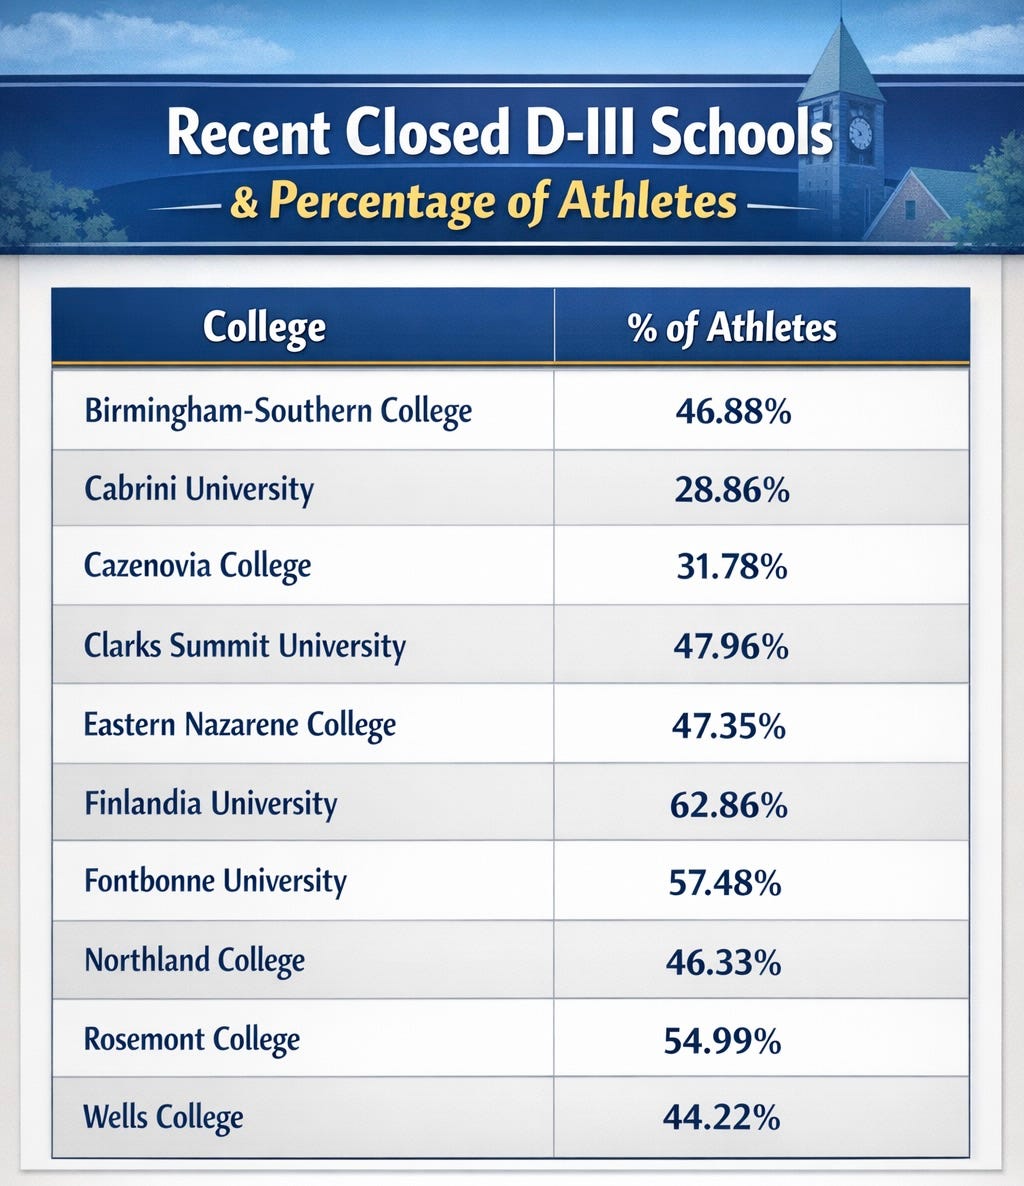
Of course, correlation does not equal causation so we can’t say that too many athletes will cause a campus to close. But if attracting tuition-paying students is necessary to stay operational, one strategy would be to increase roster size or add sports. It is my feeling that many D-III schools are doing this.
Now that you know where I get data and the lenses through which my research is conducted, let’s look at a dozen D-III schools that had the highest increase in the percent of its student body that are athletes from 2022-23 to 2023-24.
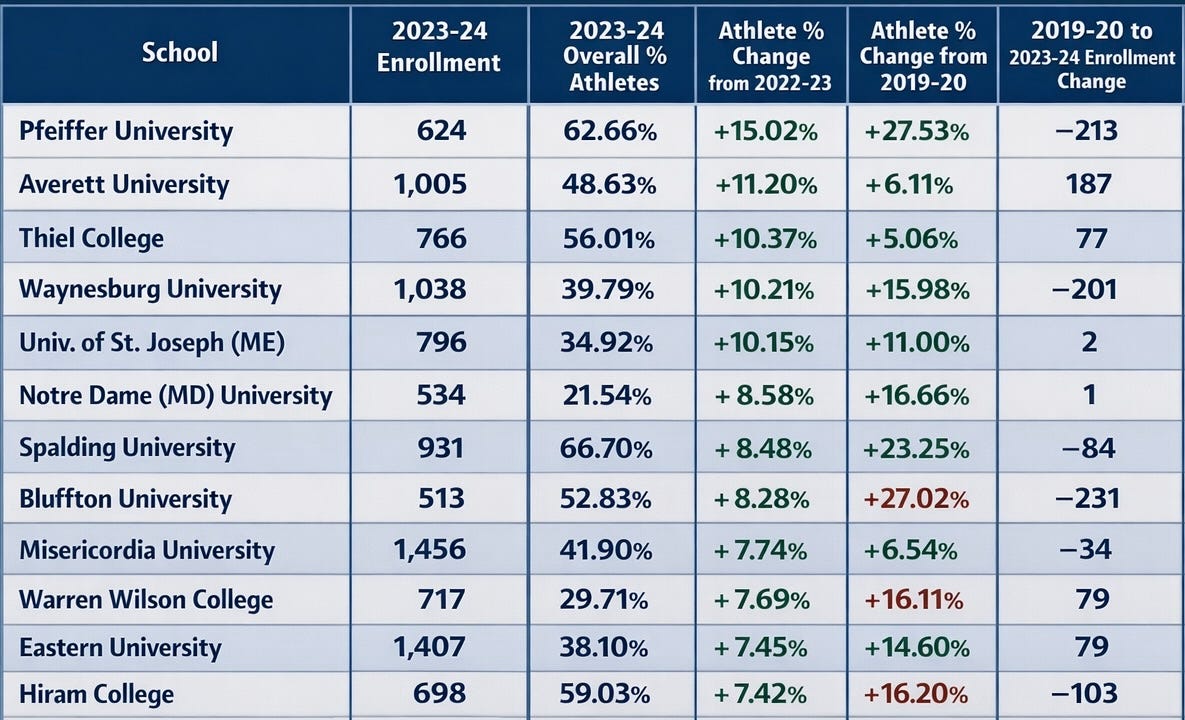
The schools at the top and bottom of this list are most interesting to me as they represent institutions struggling with enrollment but utilizing different approaches.
Pfeiffer University in Misenheimer, North Carolina reported 624 undergraduates in 2023-24, 62.66% (n=391) of whom were unduplicated athletes. That percentage was up 15.02% from 2022-23, and 27.53% from 2019-20. How do we explain the steep jump?
For starters, overall enrollment is down significantly from 837 to 624 between 2019-20 and 2023-24. Athletes, meanwhile, are up from 294 to 391. Translated, Pfeiffer enrolled 543 non-athletes in 2019-20 compared to 233 non-athletes in 2023-24, a loss of 300 non-athlete students.
Breaking that down by gender is insightful. In 2019-20, Pfeiffer reported 486 female undergraduates, 120 of whom were athletes. In 2023-24, Pfeiffer reported 297 female undergraduates, 119 of whom were athletes. Another way to look at it is Pfeiffer enrolled 194 fewer female non-athletes.
Overall male undergraduate enrollment was comparatively flat, from 351 in 2019-20 to 327 in 2023-24. The number of male athletes, however, grew from 174 to 272.
One would think this might be explained by the school adding men’s sports, but that is not the case. By my count, Pfeiffer has not added any sports since 2019. Instead, roster sizes for certain sports at Pfeiffer ballooned. Men’s basketball, which includes both Junior Varsity and Development teams to supplement its Varsity, had 55 in 2023-24, compared to 39 in 2019-20. By comparison, the women’s basketball team dropped from 22 to 14 in the same time period. Men’s lacrosse nearly doubled to 59 from 30 while women’s lacrosse dropped to 16 from 20.
To support the increased roster sizes, Pfeiffer’s reported athletic expenses in 2023-24 were $2,863,004, up roughly $1.25 million from 2019-20 when the school reported $1,572,330. Sure, more tuition-paying athletes can offset some of that, but what about the loss of 300 non-athlete students? Presumably, faculty and staff levels have remained the same or been reduced. Indeed, the school faced a number of serious threats in the past decade, not the least of which was a former CFO who embezzled $500,000 from the school.
Contrast the roster management approach with Hiram College’s aggressive adding of sports, a total of nine announced since March 2020. The school announced the addition of men’s and women’s track and cross country programs in September 2022 which really counts as six sports as cross country, indoor track & field, and outdoor track & field have separate NCAA championships.
In the news release, Hiram’s president remarked this was, in part, a response to prospective students.

These sports began at Hiram in the 2023-24 academic year and, according to the school’s EADA report, the school rostered 38 men and 41 women across all teams. What is not clear from those numbers is whether those were students competing exclusively in track or cross country. For that reason, I always look at “unduplicated participants” for the most accurate count.
Hiram reported 412 athletes among its 698 undergraduates in 2023-24 (59.03%). In 2022-23, the school reported 353 athletes among its 684 undergraduates (51.61%). Assuming all other rosters remained constant, the addition of track and cross country teams netted 59 more athletes, but only 14 more total students. In other words, the number of non-athlete students at Hiram actually decreased from 331 to 286.
Less than two years later, in June 2024, the school announced it would add men’s ice hockey, women’s bowling, and women’s lacrosse beginning with the current 2025-26 academic year. While that data is not yet reported on the EADA website, a headcount of the roster for men’s ice hockey on the school’s website (as of Jan. 4, 2026) revealed 34 athletes. Women’s bowling did not have a webpage and women’s lacrosse did not have roster or schedule pages on Jan. 4, 2026.
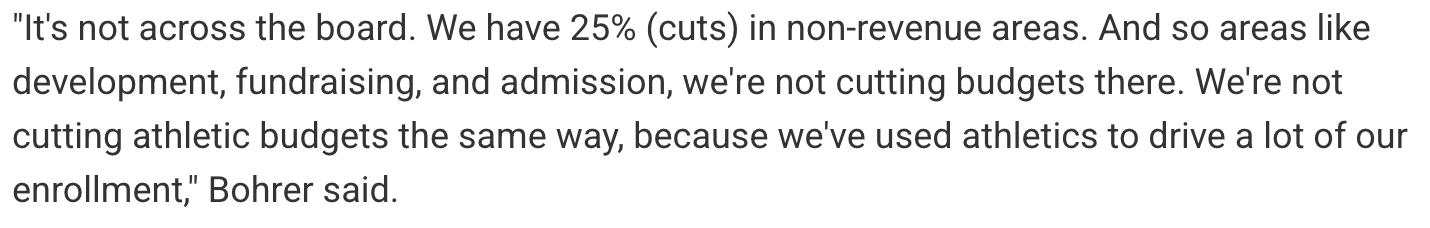
In summer 2025, Ideastream Public Media in Northeast Ohio reported on the financial difficulties facing Hiram and quoted the school’s president, Robert Bohrer II, as saying steep budget cuts were forthcoming to “non-revenue” areas of the institution. Athletics would be spared, because it generates revenue. Bohrer was not the president when the school added track and cross country programs.
The Ideastream article notes Hiram has “met its enrollment goals over the last three years, slightly increasing its on-campus student population up to about 850 students.” If true, that means the school added more than 150 total students from what it reported to the OPE for 2023-24 and now. Interestingly, according to IPEDS data, Hiram enrolled 983 undergraduates in Fall 2023, nearly 300 more than the school reported to the OPE.
Pfeiffer and Hiram are like many small private schools in D-III. They are both dealing with declining enrollment. Both are using sports to help combat that. They just differ in HOW to use sports.
Great read. I think 44% (or any %) is a useful datapoint, but as with so many situations it also comes down to leadership. I worked at an institution with some pretty visionary leaders. We likely approached 40% at one point, but that got the school over the hump and put it in a great position to thrive. Now they've been able to ease off the gas and better diversify their student body (and revenue streams).
I've also seen too many schools think they can just add without much consideration into the market or who they are hiring and have the new team evaporate into the mist.